LGTM Stack
Learning Objectives
- You know what the LGTM stack is and how it can be taken into use.
- You know how to use the LGTM stack to monitor Deno and PostgreSQL.
To concretely illustrate monitoring, we add the LGTM stack to the walking skeleton. The LGTM stack consists of Loki log database, Grafana for data visualization, Tempo for traces, and Prometheus for metrics.
All of the products in the LGTM stack come from Grafana Labs, which is a company that specializes in observability and monitoring tools. Their business model focuses on providing the products as managed services, but the projects are also open-source, which makes them nice for learning.
All of the data is collected using OpenTelemetry, which is an open-source observability framework that provides functionality for capturing traces, logs, and metrics from applications.
Adding LGTM
To add LGTM to the walking skeleton, add the following lines to the compose.yaml file.
lgtm: image: grafana/otel-lgtm:0.8.6 ports: - "3000:3000" - "4318:4318"The port 3000 is used for Grafana, and the port 4318 is used for the OpenTelemetry HTTP collector.
Then, run docker-compose up --build to start the LGTM stack. The stack takes a while to start — you can see the progress in the terminal.
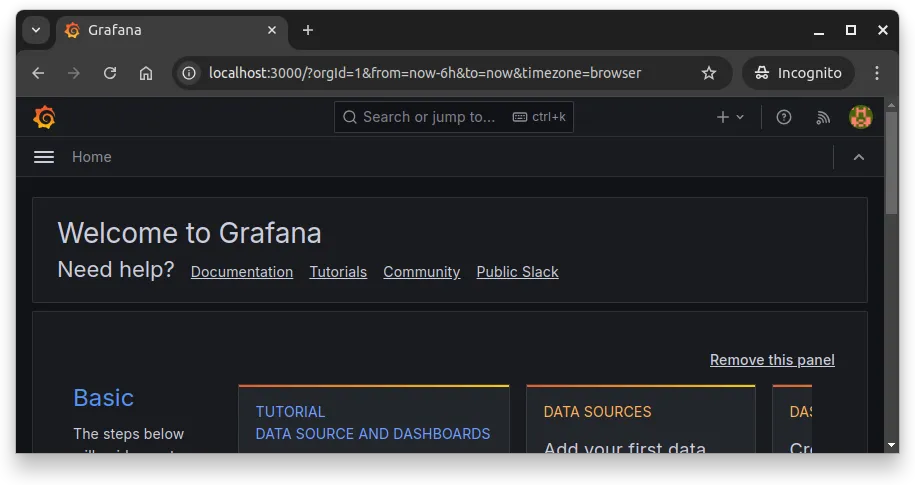
// ...lgtm-1 | Waiting for Grafana to start up...lgtm-1 | Waiting for Grafana to start up...lgtm-1 | Grafana is up and running.lgtm-1 | Waiting for Loki to start up...lgtm-1 | Waiting for Loki to start up...// ...Once LGTM is up and running, opening up the address localhost:3000 shows Grafana dashboard, similar to the one in Figure 1. The default username and password for Grafana is admin and admin.
Collecting data from Deno
Setting up data collection
Recent Deno versions come with built-in support for collecting logs and traces with OpenTelemetry. First, modify the Dockerfile in the folder server to include the flag --unstable-otel and update the Deno version to at least 2.2.0. The updated Dockerfile should look, for example, like this:
FROM denoland/deno:alpine-2.2.3
WORKDIR /app
COPY deno.json .
RUN DENO_FUTURE=1 deno install
COPY . .
CMD [ "run", "--allow-env", "--allow-net", "--allow-read", "--unstable-otel", "--watch", "app-run.js" ]
Then, modify the project.env to enable OpenTelemetry for Deno and to explicitly tell the OpenTelemetry collector where to send the data. In our case, the data collector for the lgtm service is at port 4318 — thus, we use http://lgtm:4318 to find it within the Docker Network. Further, we want to explicitly tell the name of the service so that it has a name that we can look for — below, we set the name as deno_server.
Add the following lines to the project.env file:
OTEL_DENO=trueOTEL_EXPORTER_OTLP_ENDPOINT=http://lgtm:4318OTEL_SERVICE_NAME=deno_serverNow, the Deno application sends traces and logs to the OpenTelemetry collector at http://lgtm:4318. To test this out, modify the app.js of the server to include the following endpoint.
app.get("/api/lgtm-test", (c) => { console.log("Hello log collection :)"); return c.json({ message: "Hello, world!" });});Next, restart the application and make a few requests to the endpoint http://localhost:8000/api/lgtm-test. This generates logs and traces that are sent to the OpenTelemetry collector.
For more information, including creating own metrics and traces, see Deno’s OpenTelemetry documentation.
Viewing logs and metrics
Now, log data is aggregated to the Loki database, which is part of the LGTM stack. To view the logs, go to the Grafana dashboard at localhost:3000. Open “Explore” on the left-hand side, and select “Logs”.
You should see the logs generated by the Deno application, similar to what is shown in Figure 2 below (the Figure is rather small, sorry about that — the gist is that the logs are shown in the Grafana dashboard).
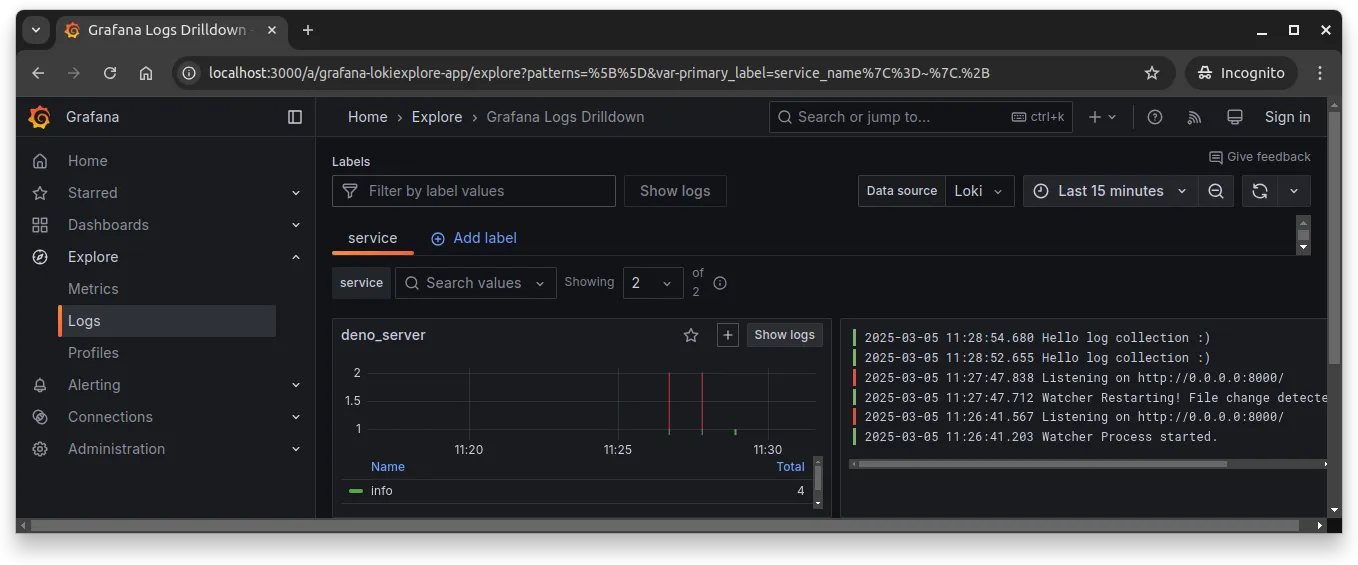
Collecting log data to a centralized location makes it easier to monitor and analyze logs. This is especially useful when running multiple services, as it allows viewing logs from all services in one place. In addition, even if a container crashes, the logs are still available in the centralized location.
Similarly, metrics that Deno sends to the OpenTelemetry collector are aggregated to Prometheus. To view the metrics, open “Explore” and select “Metrics”. In the metrics view, it is possible to limit the viewed metrics to “http_”, which then limits the metrics to those related to HTTP requests. The metrics view is shown in Figure 3 below.
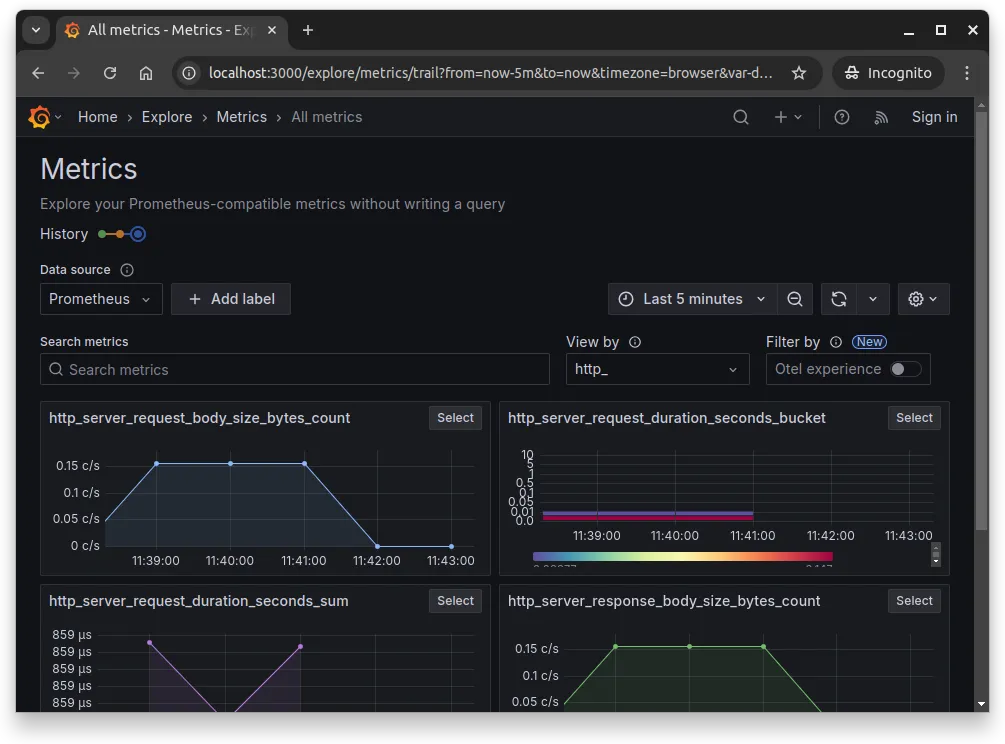
In our case, we have made just a handful of requests to the server, so the metrics are not very interesting. However, as the application scales and more requests are made, the metrics view becomes more useful.
It is also possible to set up alerts based on metrics in the Grafana dashboard. Alerts can be used to notify when certain thresholds are exceeded. For example, you could set up an alert to notify you when the average response time of the server exceeds 500ms. However, we do not go into this in more detail.
Viewing PostgreSQL data
Earlier, when setting up PostgreSQL, we also added the functionality for collecting data from the database. This involved enabling the extension pg_stat_statements.
Setting up data connection
The LGTM stack comes with a Prometheus exporter for PostgreSQL, which can be used to collect metrics from the database. To use it, open “Connections” from the left hand side menu and click “Add new connection”. Search for PostgreSQL and once found, click it. This opens a view for creating a data source for PostgreSQL.
For testing, we can use the same connection details as we normally use to connect to PostgreSQL. That is, use the following:
- Host URL:
database:5432 - Database:
database - User:
username - Password:
password
For the TLS/SSL mode, use disable. Select the same version for PostgreSQL as you have in the compose.yaml file.
Finally, click “Save & Test”. If the connection is successful, you should see a message saying “Database Connection OK”.
Studying database data
Next, under “Connections”, click “Data sources”. This should now include the PostgreSQL data source that you just created. Click “Explore” for the datasource. This opens a view where you can write database queries.
Given that the pg_stat_statements extension is enabled, you can select pg_stat_statements as the table, and e.g. select the columns “query” and “mean_exec_time”. When you press “Run query”, the query statistics are retrieved from PostgreSQL and shown in a table.
PostgreSQL data exporters
There are also PostgreSQL-specific data exporters available for Prometheus, such as postgres_exporter. OpenTelemetry has also a community contribution for collecting PostgreSQL data.
In general, these need to be run as a separate services, which then collect metrics. Exporters can be configured to collect a wide range of metrics, such as query execution times, cache hit ratios, and so on.
Dashboards
Grafana also allows constructing dashboards that provide a high-level overview of the system. As creating tailored dashboards is a bit out of scope of this course, we’ll leave it at the mention level.
To get started with Dashboards in Grafana, see e.g. Understanding Dashboards in Grafana YouTube video from Grafana labs.
Software teams often have dashboards that are visible to everyone in the team, e.g. in a big screen in the office. This way, everyone can see the status of the system at a glance.
Although the examples here focused just on Deno and PostgreSQL, the LGTM stack with OpenTelemetry can be used to collect data from a wide range of services. As an example, if we would wish to enable OpenTelemetry metric collection for Traefik, we would just need to add the two following lines to the command part of Traefik in compose.yaml:
- "--metrics.otlp=true"- "--metrics.otlp.http.endpoint=http://lgtm:4318/v1/metrics"With the above, Traefik metrics would be available in Grafana with the prefix traefik_. For further options and for understanding OpenTelemetry in depth, a good starting point is the OpenTelemetry documentation.