Performance and Profiling
Learning Objectives
- You revisit core web vitals.
- You know how to use k6 browser for measuring client-side performance.
- You know of Lighthouse and Performance tab in Chrome for browser performance testing and profiling.
In the Quantifying Performance chapter of Scalability Fundamentals, we briefly discussed Core Web Vitals. Core Web Vitals are a set of metrics introduced by Google that provide a standardized way to measure user experience associated with a page load and interaction with the page. The three primary metrics are:
-
Largest Contentful Paint (LCP): Measures the time it takes for the largest content element to load within the viewport.
-
Interaction to Next Paint (INP): Measures the longest delay between a user’s interaction and the next frame paint.
-
Cumulative Layout Shift (CLS): Quantifies the visual stability of the layout by measuring unexpected layout shifts.
Earlier, we also created a Walking Skeleton that uses k6 to run performance tests on a web application. At that point, the client-side functionality was simple; the page, shown in Figure 1, simply showed the string “DAB!” and provided no interactivity.
Browser Performance Testing
Browser performance testing focuses on measuring the performance of web applications from the client-side perspective. There are a handful of tools for measuring client-side performance, including Lighthouse and k6 browser. While lighthouse focuses on the client-side functionality, k6 browser allows you to run browser tests using the k6 testing framework, also providing insight into the server-side functionality.
Test structure
Writing tests with the k6 browser is similar to writing normal k6 tests, but with the ability to interact with the page using a browser. The common structure of a k6 browser test is as follows:
import { browser } from "k6/browser";
// test configurationexport const options = {  scenarios: {    client: {      vus: 1,      duration: "10s",      executor: "constant-vus",      options: {        browser: {          type: "chromium",        },      },    },  },};
export default async () => {  // open up a browser tab  const page = await browser.newPage();  // navigate to a page  await page.goto("https://www.aalto.fi/en");
  try {    // concrete test steps  } finally {    // always close the page at the end    await page.close();  }};
Above, we define the test configuration (one virtual user, running for the duration of ten seconds, using chromium), and the concrete test.
The test opens up a browser tab and navigates to the Aalto University website. Then, if there would be test steps, they would be executed, and finally, the browser tab is closed. Closing the browser tab is done in a finally block of a try statement to ensure that the browser tab is closed even if an error occurs during the test.
Test functionality
Tests written with k6 browser focuses on selecting elements and interacting with them. The elements are selected using CSS selectors or XPath expressions, e.g., #id or //button[text()="Add item"]. The selectors are written in plain text.
The plain-text selectors are passed to the locator method of the page object. The locator method returns a locator object that can be used to interact with the element. The locator object has functions like click, fill, and isVisible.
As an example, the steps for selecting an element with the id btn, clicking it, and then waiting for a paragraph element with the text Item 1 to be visible could be written as follows:
await page.locator('#btn').click();await page.locator(`//p[text()="Item 1"]`).isVisible();The above could be also divided into four lines, each step on its own line:
const btn = page.locator('#btn');await btn.click();const item1 = page.locator(`//p[text()="Item 1"]`);await item1.isVisible();The developer tools of a browser provide a way to inspect elements on a page and get the selector for them, which can act as a starting point for defining selectors. As an example:
- Right-click the above “DevTools” text.
- Select “Inspect” from the shown context menu. This opens up developer tools and highlights the element in an Elements tab.
- Right-click the highlighted element in the Elements tab.
- Select “Copy” -> “Copy selector” from the context menu. This copies the selector to the clipboard.
Alternatively, you may try to click “Copy XPath” to get an XPath expression for the element. The copied selector can be pasted into the test code.
Example: Running tests
Let’s consider an example where we have a simple page with a button that adds items to a list. Modify the index.astro file in the client/src/pages of the walking skeleton to include the following content:
---import Layout from "../layouts/Layout.astro";---
<Layout>  <p>DAB!</p>  <button id="btn">Add item</button>  <ul id="list">  </ul>
  <script>    const btn = document.getElementById('btn');    const list = document.getElementById('list');    let count = 1;
    btn.addEventListener('click', async () => {      const li = document.createElement('li');      li.textContent = `Item ${count}`;      list.appendChild(li);      count++;    });  </script></Layout>
The above creates a page with a button that adds items to a list when clicked. The items are added to an unordered list, and each item is labeled with a number, starting from 1.
Next, modify the file hello-k6.js in k6-tests/tests directory of the walking skeleton, placing the following content to the file. The following defines a test that opens up a browser tab, navigates to the page, clicks the button four times, and checks that the items are added to the list. The test runs for 30 seconds with five virtual users — the address client:4321 is used, as the test is run from within the Docker network.
import { browser } from "k6/browser";
export const options = {  scenarios: {    client: {      vus: 5,      duration: "30s",      executor: "constant-vus",      options: {        browser: {          type: "chromium",        },      },    },  },};
export default async () => {  const page = await browser.newPage();  await page.goto("http://client:4321/");
  try {    for (let i = 1; i < 5; i++) {      await page.locator('//button[text()="Add item"]').click();      await page.locator(`//li[text()="Item ${i}"]`).isVisible();    }  } finally {    await page.close();  }};
To run the test, with the walking skeleton up and running, we use the command docker compose run --rm --entrypoint=k6 k6-tests run /tests/hello-k6.js. The output of the test should be similar to the following:
browser_data_received.......: 160 MB 5.1 MB/sbrowser_data_sent...........: 1.4 MB 44 kB/sbrowser_http_req_duration...: avg=33.66ms min=1.89ms med=30.2ms max=115.15ms p(90)=60.48ms p(95)=70.24msbrowser_http_req_failed.....: 0.00% 0 out of 3600browser_web_vital_cls.......: avg=0 min=0 med=0 max=0 p(90)=0 p(95)=0browser_web_vital_fcp.......: avg=56.07ms min=35.6ms med=54.4ms max=104.6ms p(90)=75.3ms p(95)=81.09msbrowser_web_vital_fid.......: avg=988.88µs min=399.99µs med=800µs max=3.29ms p(90)=1.71ms p(95)=1.95msbrowser_web_vital_inp.......: avg=56.44ms min=24ms med=56ms max=112ms p(90)=72ms p(95)=80msbrowser_web_vital_lcp.......: avg=56.07ms min=35.6ms med=54.4ms max=104.6ms p(90)=75.3ms p(95)=81.09msbrowser_web_vital_ttfb......: avg=12.36ms min=4.69ms med=9.45ms max=37.39ms p(90)=24.57ms p(95)=28.68msdata_received...............: 0 B 0 B/sdata_sent...................: 0 B 0 B/siteration_duration..........: avg=1.41s min=1.31s med=1.41s max=1.52s p(90)=1.47s p(95)=1.49siterations..................: 90 2.866126/svus.........................: 5 min=5 max=5vus_max.....................: 5 min=5 max=5From the above test, we can see that the test passed successfully, and the items were added to the list as expected. The test also provides metrics related to the performance of the page, including the core web vitals like largest contentful paint (browser_web_vital_lcp), interaction to next paint (browser_web_vital_inp), and cumulative layout shift (browser_web_vital_cls).
For these, the results show that the largest contentful paint is around 56ms, the interaction to next paint is around 56ms, and the cumulative layout shift is zero, as the page is simple and does not have a large content element. Other metrics, like first contentful paint (browser_web_vital_fcp), first input delay (browser_web_vital_fid), and time to first byte (browser_web_vital_ttfb), are also provided.
Note that browser testing is not used for load testing or server-side performance testing, but rather for measuring the performance of the client-side functionality of a web application. From the above, we can also see that with the five virtual users, there were approximately 2.87 iterations per second — with such small tests, most of the time is spent on setting up and tearing down the browser tabs.
Profiling
The k6 browser provides a controlled way to measure the performance of a web application from the client-side perspective, where the developer can define what steps to take and what to measure. However, for more detailed profiling and performance analysis, audit tools such as Lighthouse are more commonly used.
Lighthouse audit
For example, in Chrome, you can open up the developer tools by pressing F12 or right-clicking on the page and selecting “Inspect”. In the developer tools, you can navigate to the “Lighthouse” tab, which allows analyzing page load. Figure 2 below shows what the Lighthouse tab looks like in Chrome.
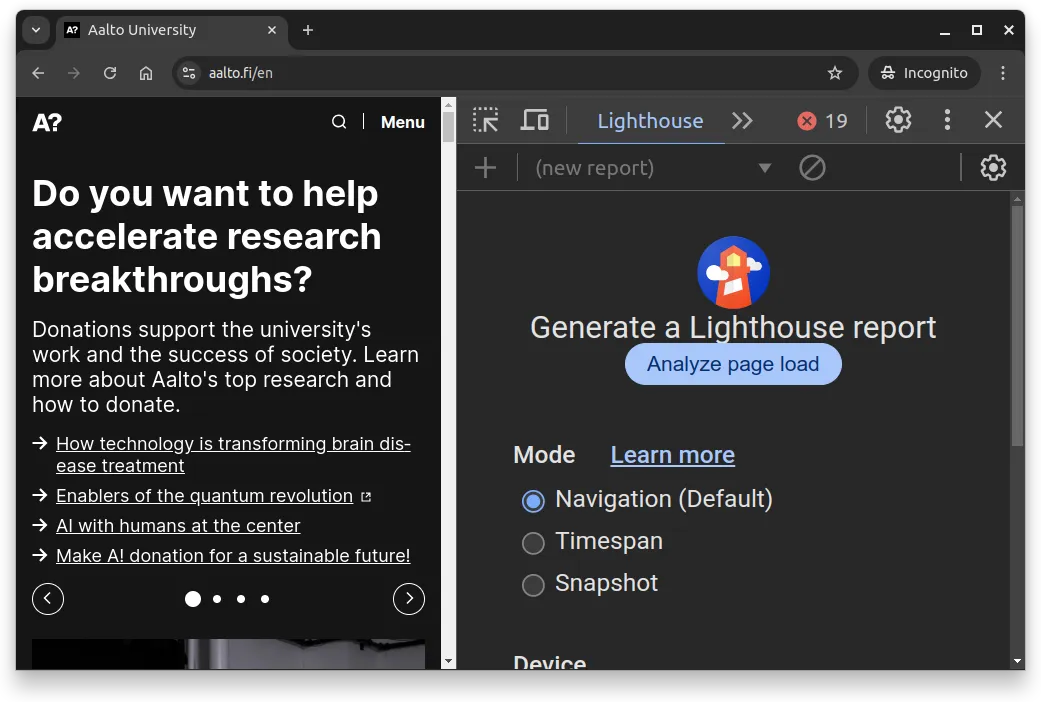
When you click the “Analyze page load”, Lighthouse analyzes the page and generates a report that includes metrics like performance, accessibility, best practices, and SEO. All of these are further broken down in the report, providing insights into what can be improved to enhance the performance of the page. As an example, at the time of writing these materials, Lighthouse diagnostics point out that the largest contentful paint element should be improved, and that over 80% of the time on the largest contentful paint relates to render delay.
Render delay steps from the cumulative time spent on resource fetching, script execution, and rendering, which must happen before the browser can display the largest contentful paint element. All of these can be optimized to reduce the render delay.
For more information on Lighthouse (and related tooling), see Demystifying Speed Tooling video on YouTube.
Profiling
The developers tools in Chrome has also a Performance tab that can be used to profile the performance of a web application. The Performance tab provides a way to record and analyze the interaction with a page. For example, if some part of a site is slow, the performance recording can be used to view a detailed breakdown of what functions the time is being spent, which allows pinpointing causes of slowness.
As a concrete example, do the following:
- Visit the TUI site and choose “Package Holidays”.
- Choose a departure airport without selecting a destination. Then, fill in some departure date, and search for options.
- When the site shows the search results, click “Room Only” from the “Board” section. This action is very slow.
- Once you’ve noticed the slow response, open up the developer tools, and navigate to the Performance tab.
- Start recording.
- Press the “Room Only” selection again, and wait until the action finishes.
- Stop recording.
- Analyze the performance.
In the above case, in the slow action, there are long-running tasks at the beginning and at the end, and a long network request in between. The above slowness is especially surprising as the page only shows 10 results to the user by default, and additional results are only loaded when the user scrolls down.
Knowing that even a 100-millisecond delay can reduce conversion rates by 7 percent, it is clear that TUI is losing money all the time with their current design. 💸